For agricultural and forestry teams
Viewing agricultural and forestry GeoTIFF imagery for reports
Make imagery understandable without turning display colors into unsupported agronomic conclusions.
Reviewed:
Use the viewer to inspect supplied imagery and prepare a communication image. It does not calculate NDVI, classify land cover or diagnose crop and forest health.
On this page
Identify the product before interpreting it
A farm or forest TIFF might contain RGB imagery, separate spectral channels or a previously calculated index. Those products require different interpretation. Start with the provider's band descriptions, processing level, units, scale and NoData definition; a filename alone is not enough.
The viewer reports basic file information but does not automatically read and apply every provider's scientific calibration. Do not treat screen brightness as a calibrated measurement.
Choose a supported display workflow
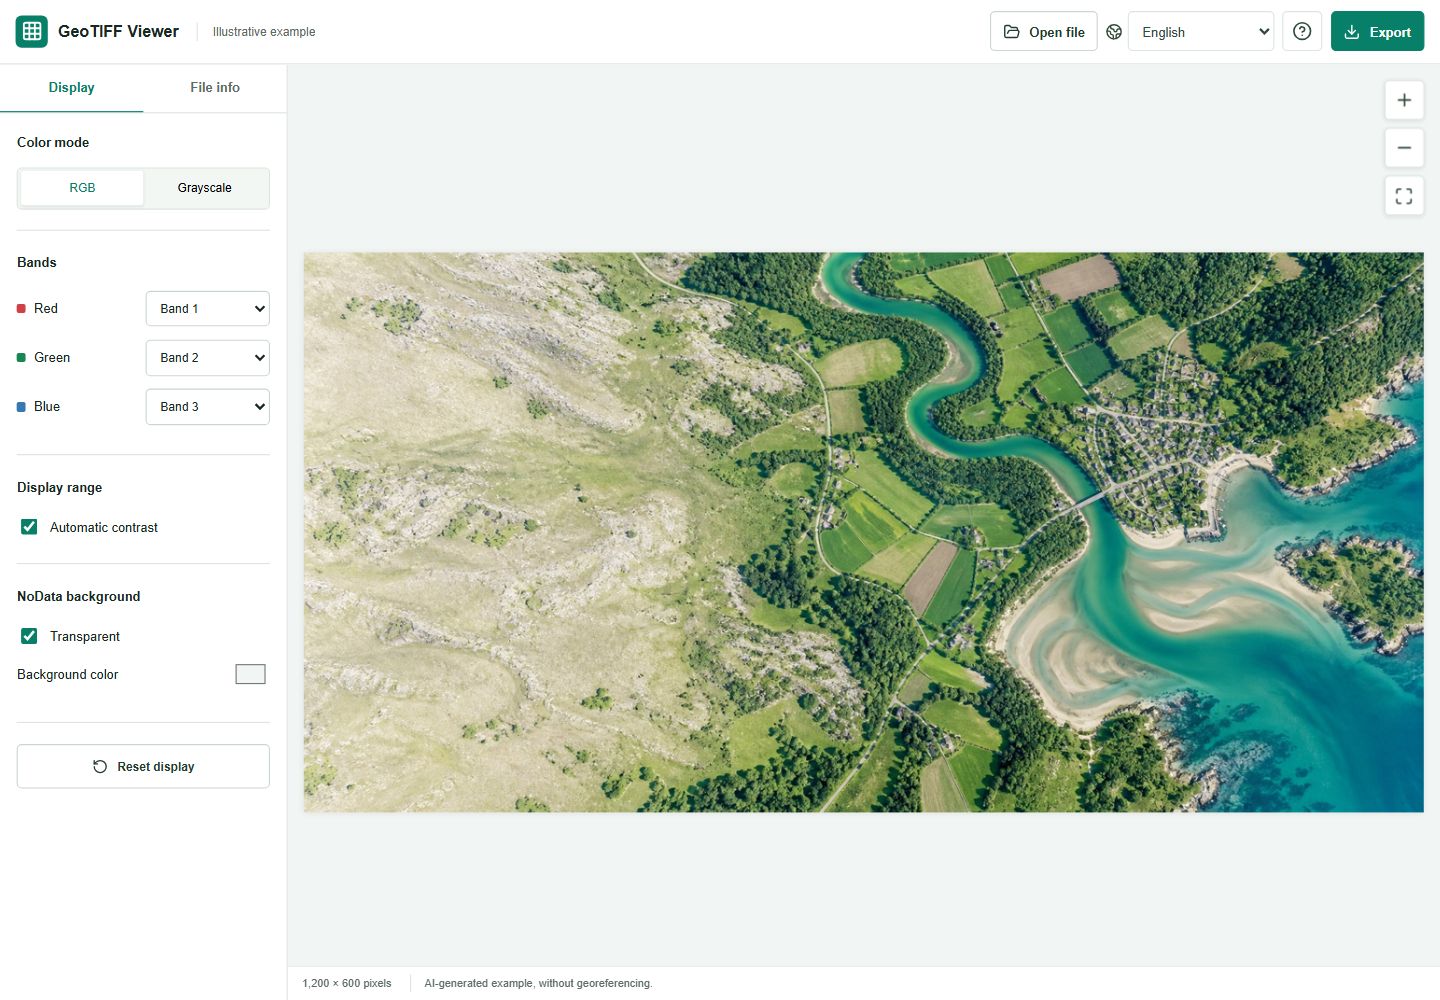
For an RGB extract, use the documented channel assignment. For a supported single-band numeric raster, grayscale can help inspect the distribution visually. A categorical or palette-based product may need a properly rendered RGB export from GIS software instead.
- Confirm which variable each band contains before assigning colors.
- Use a documented display range when consistency matters.
- Inspect recognized NoData regions separately from dark valid pixels.
- Record the settings with the exported image for colleagues.
A vegetation index is a calculation, not a green picture
NDVI uses red and near-infrared values in a normalized calculation. Selecting a green-looking display or increasing contrast does not perform that calculation. Our viewer has no raster calculator and does not produce NDVI from input bands.
Even if you open an NDVI raster produced elsewhere, this viewer's exported picture is not the original index data. Use the source values and an appropriate analytical workflow for thresholds, summaries or comparisons.
Reference: USGS: Landsat normalized difference vegetation index
Avoid reading health directly from display color
False-color composites assign bands to screen colors to emphasize particular features. The same visible color can mean different things under another assignment. Explain the band mapping alongside the picture.
A hypothetical field-team handoff could include a small image extract and a request to inspect a patch in the original data. It should not claim that the viewer has identified disease, estimated yield or confirmed tree loss.
Prepare the report and preserve the evidence
Export a preview, then add source, acquisition date, band mapping, display range and known limitations in the report. Keep the original raster and processing notes available to the analyst. The image is a communication aid, not the scientific archive.
For repeated visits or dates, use a dedicated analytical workflow to account for sensor, processing and observation differences. Merely opening files with independent automatic contrast is not a controlled change analysis.