For environmental researchers and project teams
Preparing GeoTIFF previews for environmental and ecological reports
Turn an existing raster into a readable figure without losing track of what its values mean.
Reviewed:
A readable figure can support a report, but its display colors are not a measurement. Check the product definition and retain the original raster for quantitative work.
On this page
Separate a scientific raster from its presentation
An environmental dataset may contain a continuous variable, an index or categorical classes. Decide which one you have before choosing a display. A grayscale view may suit a supported numeric raster; a class map with a required legend is better rendered in GIS software.
This viewer does not apply a specialist color ramp, construct a scientific legend or infer units. If those elements are essential to understanding the result, prepare the figure in an application that supports them.
Check the data context first
Use the provider's documentation alongside File information. Missing or unrecognized metadata should prompt a check, not an invented assumption.
- Confirm the variable, units and any scale or offset applied upstream.
- Check source date, coverage and coordinate reference against the project notes.
- Understand whether NoData means outside coverage, masking or another documented condition.
- Decide which display range is appropriate for the question in the report.
Make empty regions and valid low values distinguishable
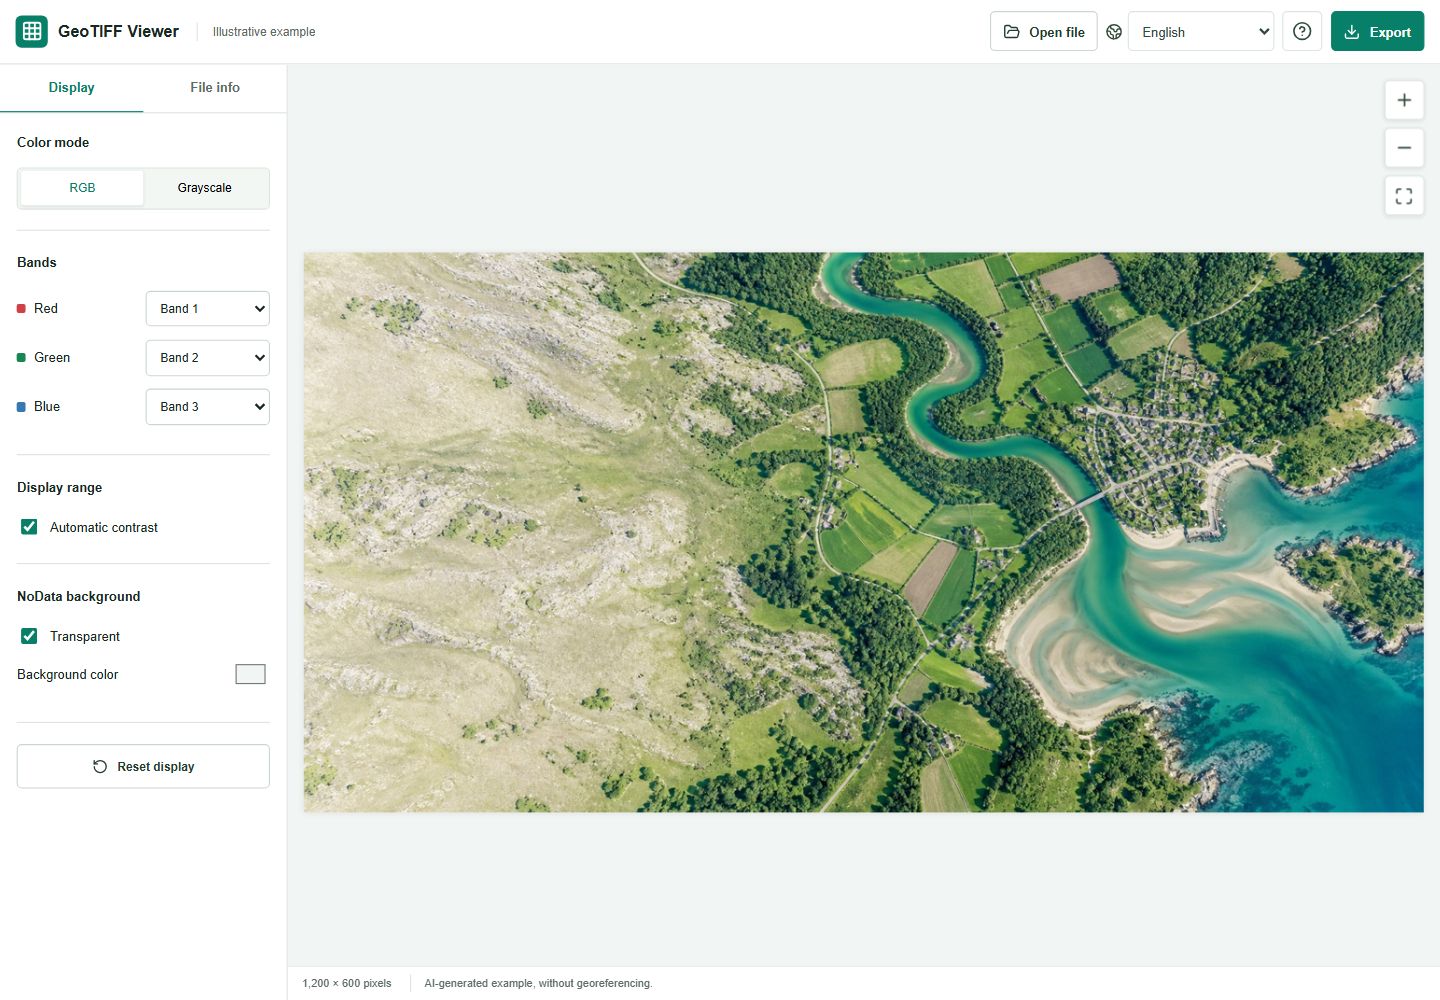
A dark valid pixel and a NoData cell are not interchangeable. When the file provides a recognized NoData value, use the background or transparency controls to make gaps visible. Do not describe those gaps as low measurements.
If the supplied raster lacks a usable NoData definition, this viewer does not provide an editor for fixing it. Correct the data preparation in GIS software and keep a record of the change.
Keep display choices consistent, without claiming comparability
For related figures of the same variable and compatible units, record and reuse a justified display range. Independent automatic contrast can make similar datasets look different or hide meaningful differences.
A shared range alone does not make different dates or sensors scientifically comparable. Spatial alignment, calibration, quality masks and methodology still need assessment outside this viewer. It provides neither a time-series analysis nor a side-by-side comparison workspace.
Reference: QGIS: raster display and contrast settings
Write a caption that survives being shared
A useful caption names the variable, source, observation period, display range, treatment of missing data and whether the image was reduced. Add the caption in the report; export does not insert it automatically.
Retain the original GeoTIFF, provider metadata and any analysis outputs. The exported PNG or JPG stores rendered colors at preview resolution, not the measurements required to reproduce a result. Do not use our AI demo as environmental evidence.