For anyone with an unreadable preview
Why does my GeoTIFF look black, washed out or oddly colored?
Check the display settings before assuming your TIFF is empty or damaged.
Reviewed:
A black preview does not automatically mean the file is broken. First check the selected band and display range. Contrast can reveal valid values, but it cannot recover missing data.
On this page
The data and the visible brightness are different things
A raster may contain 16-bit integers or floating-point values, rather than the familiar 8-bit color channels of a photo. A display range that does not match those values can make most of the picture appear black or white. Contrast stretching maps a chosen range of source values to the screen's brightness range.
The right range depends on the dataset. Do not copy a minimum and maximum from an unrelated satellite product and assume they are universal.
Reference: QGIS: raster display and contrast settings
Check these settings in order
Begin with a supported file that has finished loading. Change one setting at a time so you can tell what helped.
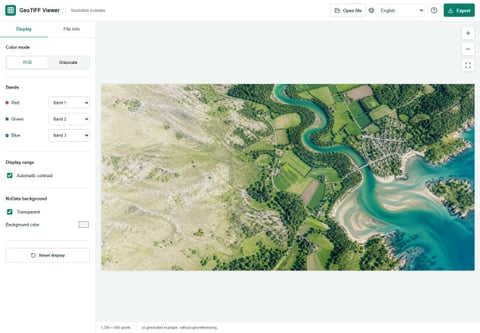
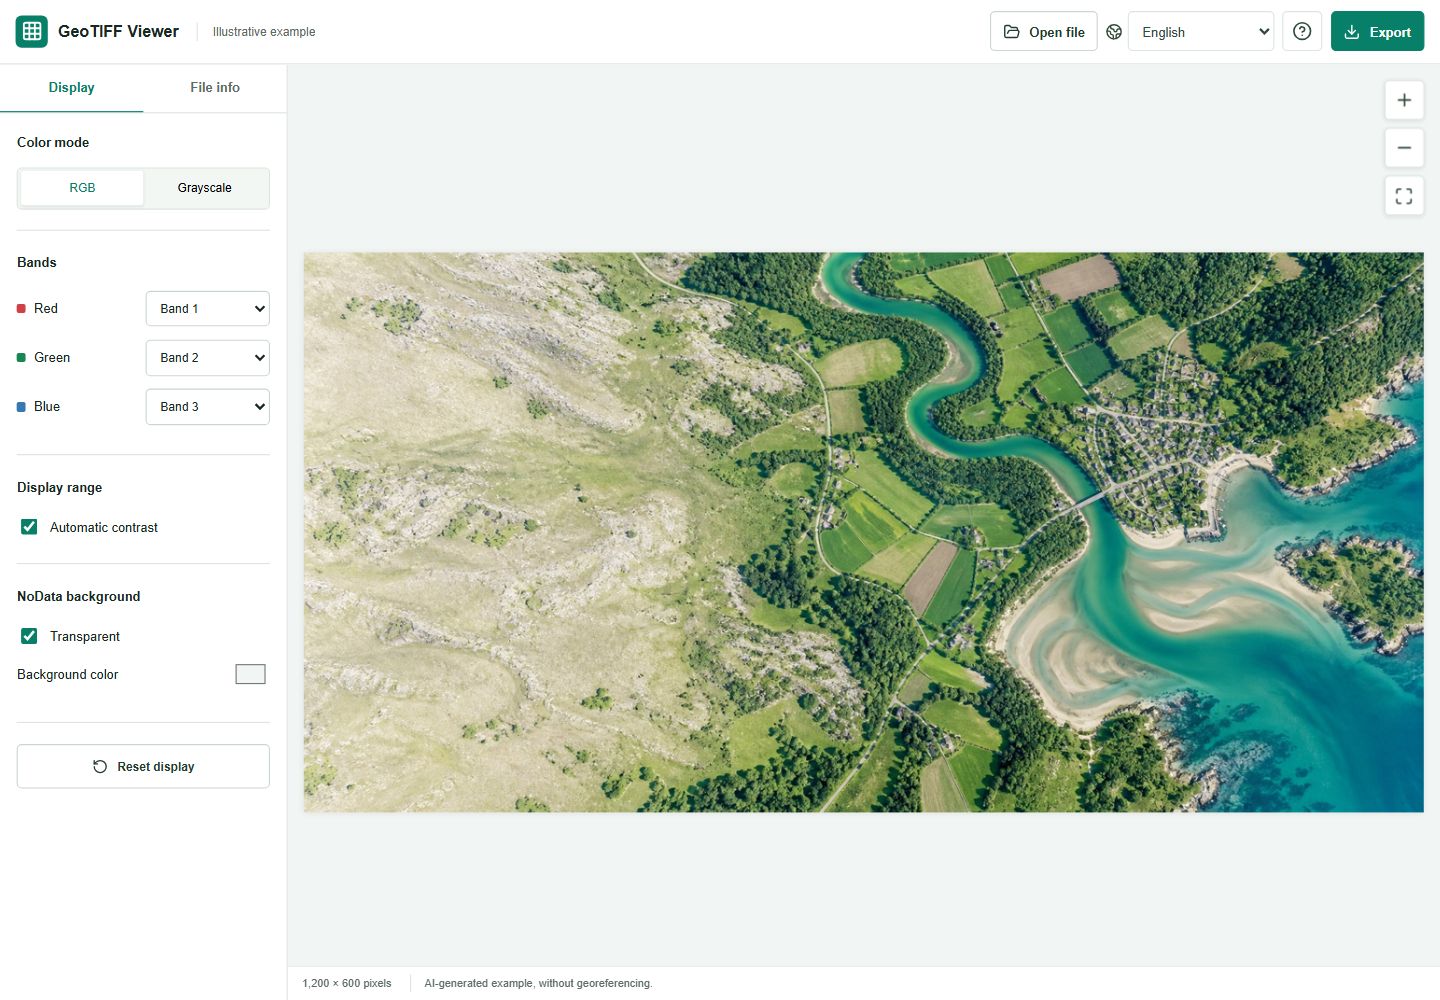
- Inspect File information: check whether the image has one band or several.
- For one band, use grayscale. For a color image, assign the documented bands to the red, green and blue display channels.
- Enable automatic contrast. If an ordinary 8-bit RGB picture still has poor contrast, try a manual range appropriate to its values.
- For a manual range, enter a minimum below the maximum and apply it. Reset the display if you lose track of the settings.
Strange colors can be intentional
Band numbers describe their order in this file, not a universal sensor convention. Ask the provider which wavelengths or variables the bands contain. A false-color image deliberately assigns selected bands to visible colors; red vegetation is not, by itself, an error.
This viewer lets you assign bands already present in a file. It does not identify their scientific meaning or combine separate TIFF files into a new multiband dataset.
An empty area may be NoData
NoData marks cells that should not be treated as ordinary measurements. A recognized NoData area may appear transparent or use the selected background color. Changing that background can make the footprint easier to see, but it does not fill the gaps.
If the viewer reports no displayable values, try another valid band. If every band is empty, check the file in GIS software or with the supplier. The browser cannot reconstruct absent pixels.
Know when to stop adjusting
A decode error, an unsupported TIFF layout or a file-size rejection is not a contrast problem. Use a complete supported RGB or grayscale export, or prepare a smaller raster in GIS software. Keep the failing original for diagnosis.
If several scientific images need comparison, record the band assignment and display range. Different automatic stretches can make unchanged values look different. A pleasing preview is not proof of data quality or physical change.