For teachers and students
Using GeoTIFF files in geography lessons and student assignments
Build a short lesson around seeing, describing and explaining a raster image.
Reviewed:
Use the viewer for a focused lesson on reading an existing raster and explaining its display. Keep spatial analysis, measurements and assessed scientific calculations in appropriate GIS software.
On this page
Start with a question students can answer
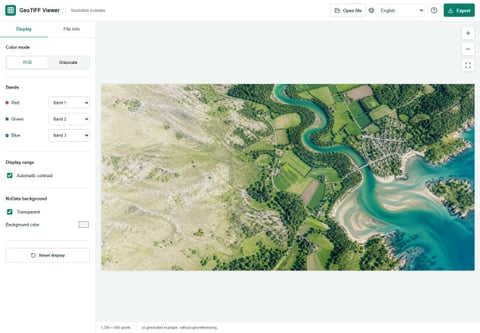
A useful first exercise is not simply 'open this file'. Ask students which features they can describe, which display settings they used and what additional information they would need to interpret the image. For example, a teacher might provide a small RGB extract and ask students to describe visible patterns without assigning unverified land-use labels.
This is a suggested classroom activity, not a report of a real study. The bundled AI demo is suitable for practicing controls only; it must not be presented as a real place or used as observational evidence.
Prepare a manageable class file
Before the lesson, test the exact file on a representative student device. Supply a supported TIFF that is comfortably below the stated limits, along with its source, date, band descriptions and reuse conditions. Do not make students diagnose a multi-gigabyte raster during a short class.
If students have separate single-band files, assemble the required dataset in GIS software beforehand. This viewer opens one file at a time and does not stack separate files.
A short observation exercise
Keep the exercise reproducible by asking students to record their choices.
- Open the file and note dimensions, band count and available CRS information.
- Describe visible shapes and patterns before suggesting what caused them.
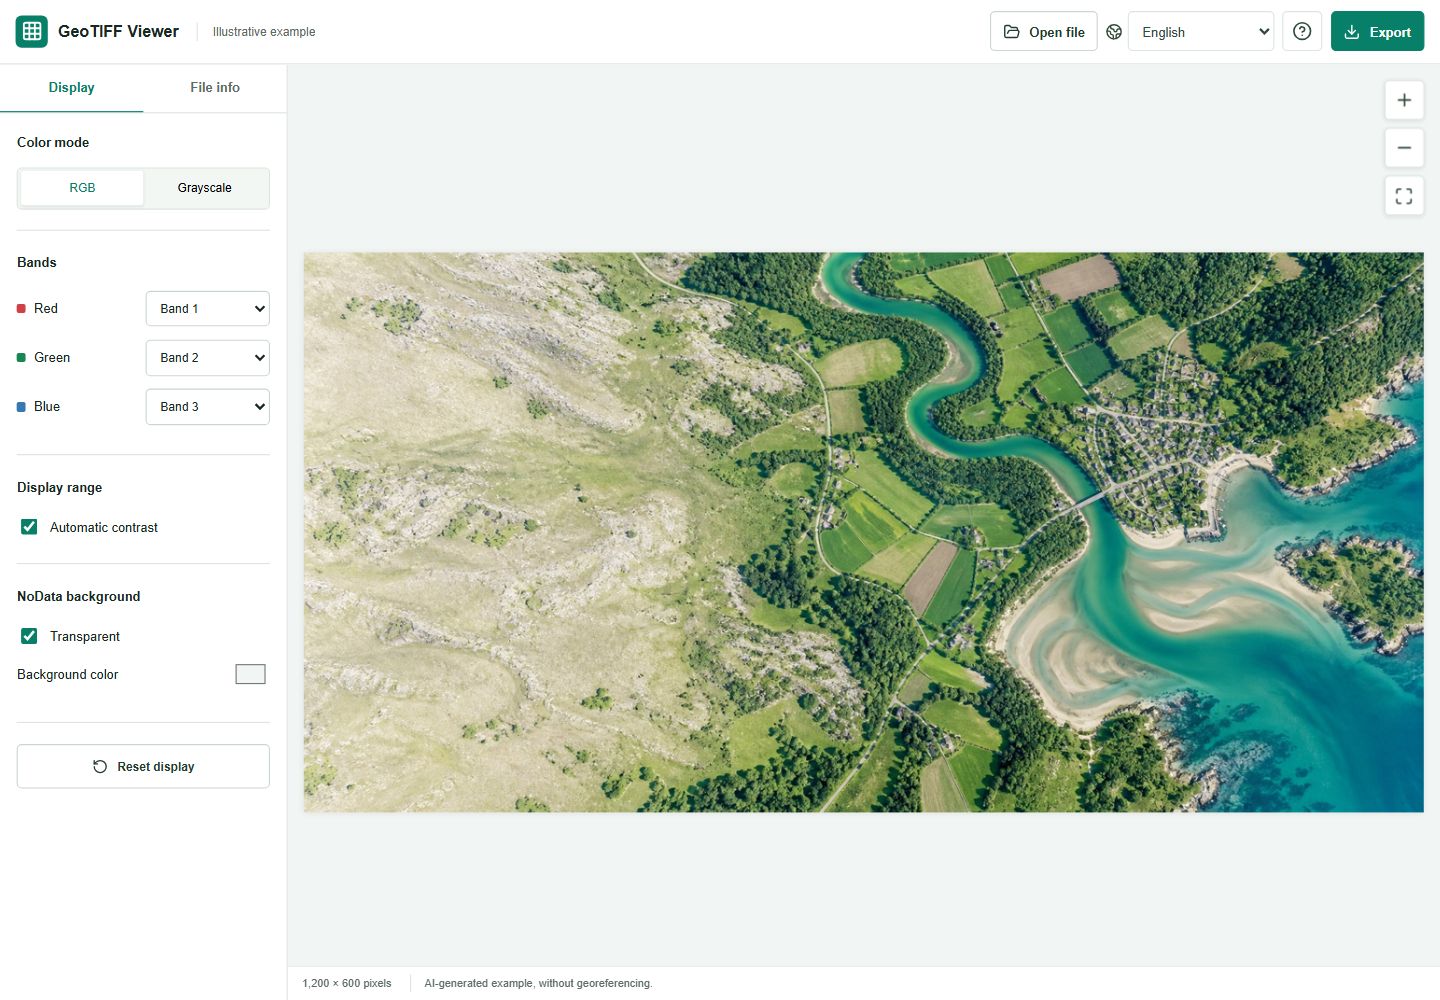
- Change the band assignment or contrast, then explain why the appearance changed.
- Export a preview and write a caption that separates direct observation from interpretation.
Teach color as a display choice
A false-color display can use wavelengths outside visible light. Its colors must be interpreted using the band assignment, not everyday color assumptions. Give students the relevant band descriptions instead of asking them to guess what a red or blue region means.
In the viewer, band selection changes the display only. It does not establish that a feature is water, woodland or a damaged crop.
Set an honest submission requirement
Ask for the exported picture, a short interpretation and the settings used. Require the original data reference as well. Explain that the preview has reduced resolution and no georeferencing, so the picture alone cannot reproduce a GIS analysis.
If the assignment requires distances, areas, coordinate transformations or pixel statistics, provide a GIS workflow instead. A browser viewing exercise can prepare students for that work, but cannot replace it.