Direct answer
GeoTIFF Viewer: Bands, Metadata and Coordinates
Read bands and spatial metadata in the right order so a useful preview is not mistaken for verified GIS analysis.
Reviewed:
Start with metadata, then bands, then coordinates: confirm raster dimensions and band count, read any recognized CRS and bounds, select only documented bands for display, and use cursor coordinates as orientation. The viewer can expose file information, but it cannot verify scientific meaning or positional accuracy.
On this page
Separate pixels from location
Raster pixels store values in rows, columns and bands. GeoTIFF tags can relate that raster space to a model coordinate reference system. Both parts matter, and either can be incomplete.
A colorful image can lack usable georeferencing; a well-georeferenced raster can contain non-visual scientific values.
Read the metadata before styling
Record width, height, data type, band count, no-data information when available, CRS and bounds. Compare them with the provider documentation rather than guessing from appearance.
Unexpected units or missing CRS information are reasons to pause, not invitations to assign a familiar system.
Map bands to visible channels
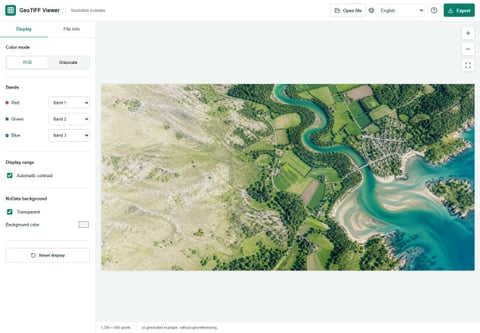
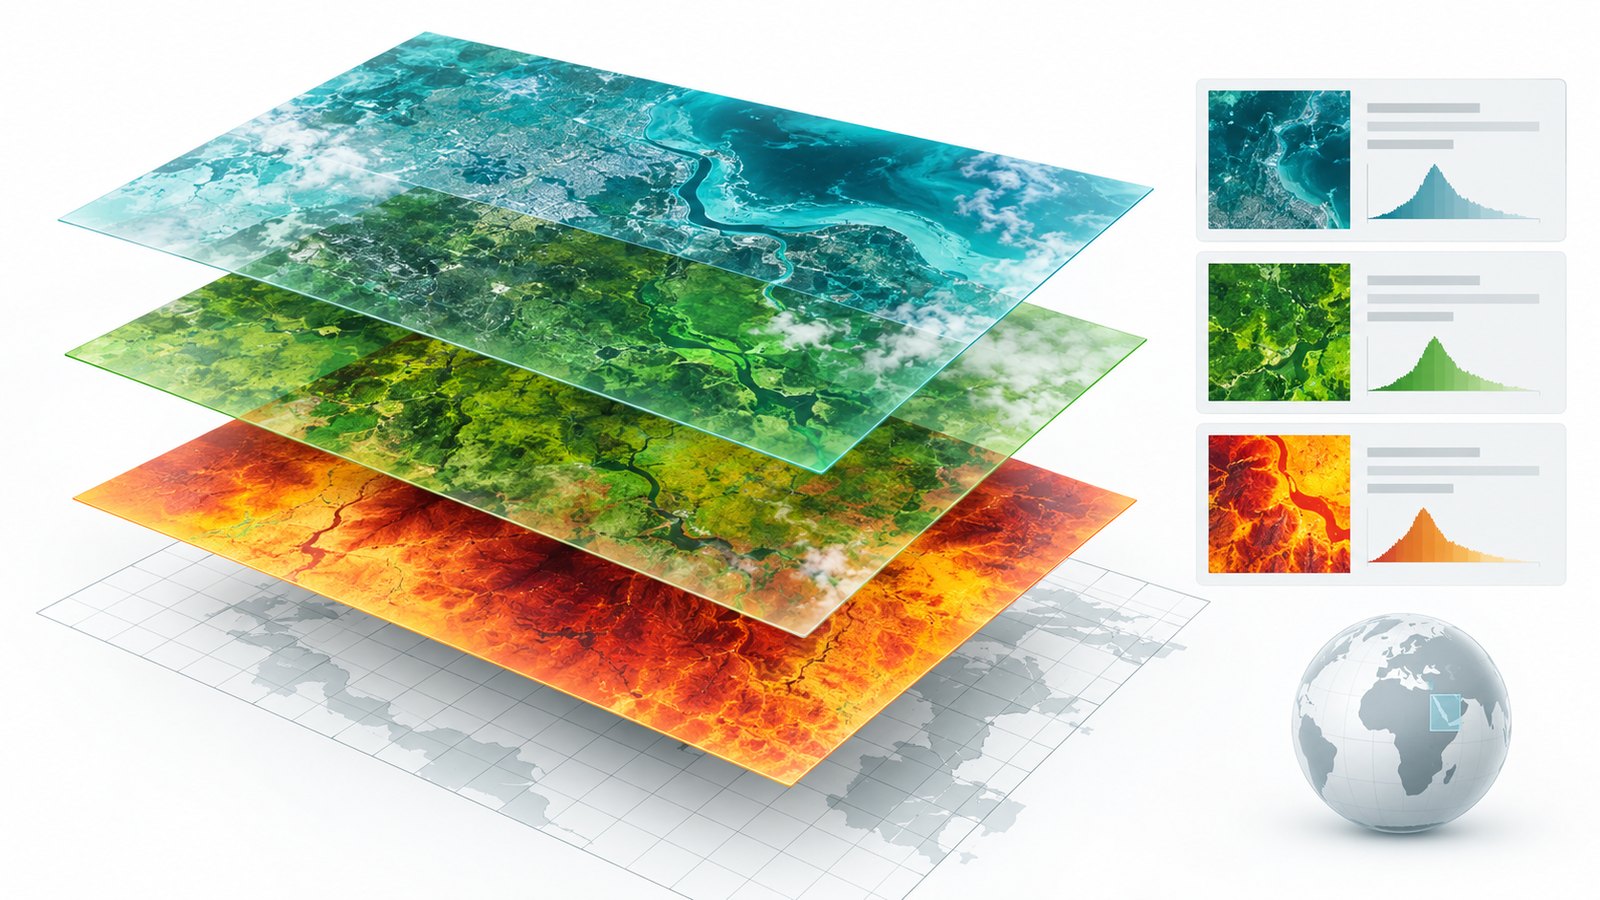
Each band is an array of values. RGB display assigns three selected bands to visible red, green and blue; grayscale displays one band.
Band 1 is not universally blue, red or elevation. Use the dataset specification, and label false-color combinations honestly.
Use range controls as visualization
Display minimum and maximum values control the visible stretch. They can expose detail in a narrow numeric range but do not normalize datasets for scientific comparison.
Save the chosen band mapping and stretch when screenshots must be reproducible.
Interpret coordinates in their CRS
Cursor and corner coordinates only make sense with the reported CRS and units. Projected coordinates may be metres or feet, while geographic coordinates are commonly angular values.
The browser tool does not reproject, align the raster to property boundaries or validate ground-control points. Use GIS for those tasks.
Escalate when the question becomes analysis
Move to QGIS, GDAL or another suitable workflow for statistics, band math, reprojection, mosaics, classification or measurement. Keep the browser viewer for triage and communication.
This division prevents a convenient preview from becoming unsupported evidence.
FAQ
What does “band” mean in a GeoTIFF?
A band is one two-dimensional array of pixel values; several bands may represent colors, wavelengths or other variables.
Can the viewer identify what every band measures?
No. Scientific meaning must come from provider metadata or dataset documentation.
Are displayed coordinates always latitude and longitude?
No. They follow the file’s recognized coordinate reference system and may use projected units.
Can I compare values between two previews?
Not reliably from appearance alone; matching bands, ranges, processing and source values are required.
Technical references
Use the tool as a first step
Inspect the file locally, then move to GIS when the question requires analysis, reprojection or measurement.